
Value stream mapping of a healthcare process
Dnia 21 June 2016, autor Katarzyna Złotowska
How to map a process?
How can we know the process in which we are participants or owners and have big influence for its efficiency? Sometimes we are not aware how detailes is the process and how many factors affects for realization. If we want to analyze in details the process, know strenghts and weak side we should go to GEMBA. It is real place of process.
VSM is divided into 4 steps
- Draw main flowchart with bigger steps.
- Draw value stream map with details.
- Conduct analysis and prepare future state map.
- Implement changes and do continuous improvement.
Process improvement using value stream mapping
Value stream mapping let us to prepare “road map” for process participants in medical unit. Tool is to spread out the prime factors and analysis each steps. The process is divide on activities that gives values, thanks to that patients receive what they need and activities, which doesn’t give value but has to be present and also in the process are activities which could be eliminated because doesn’t give value, it is 8 types of wastes:
- Motion
- Transport
- Waiting
- Over-processing
- Inventory
- Mistakes
- Over-production
- Wasted human potential
Lean healthcare use this tool in order to know better process, collect all relevant data and eliminate wastes. Based on current state is possible to find out weak points that can be improved. Sometimes analysis can be activated after serious problem occurred, sometimes it could be top management initiative or willingness to implement lean hospitals philosophy.
Key features of value stream mapping
- Process optimization
- Clinical risk analysis
- Time reduction for medical activities
- Descrease processes costs
- Elimination bottlenecks
- Create new standard for process – procedure
- Decrease quantity of adverse events, medical mistakes and nonconformities
Sustaining defined standards for process let us to find out immediately every mistake and deviation so we can react fast and eliminate them.
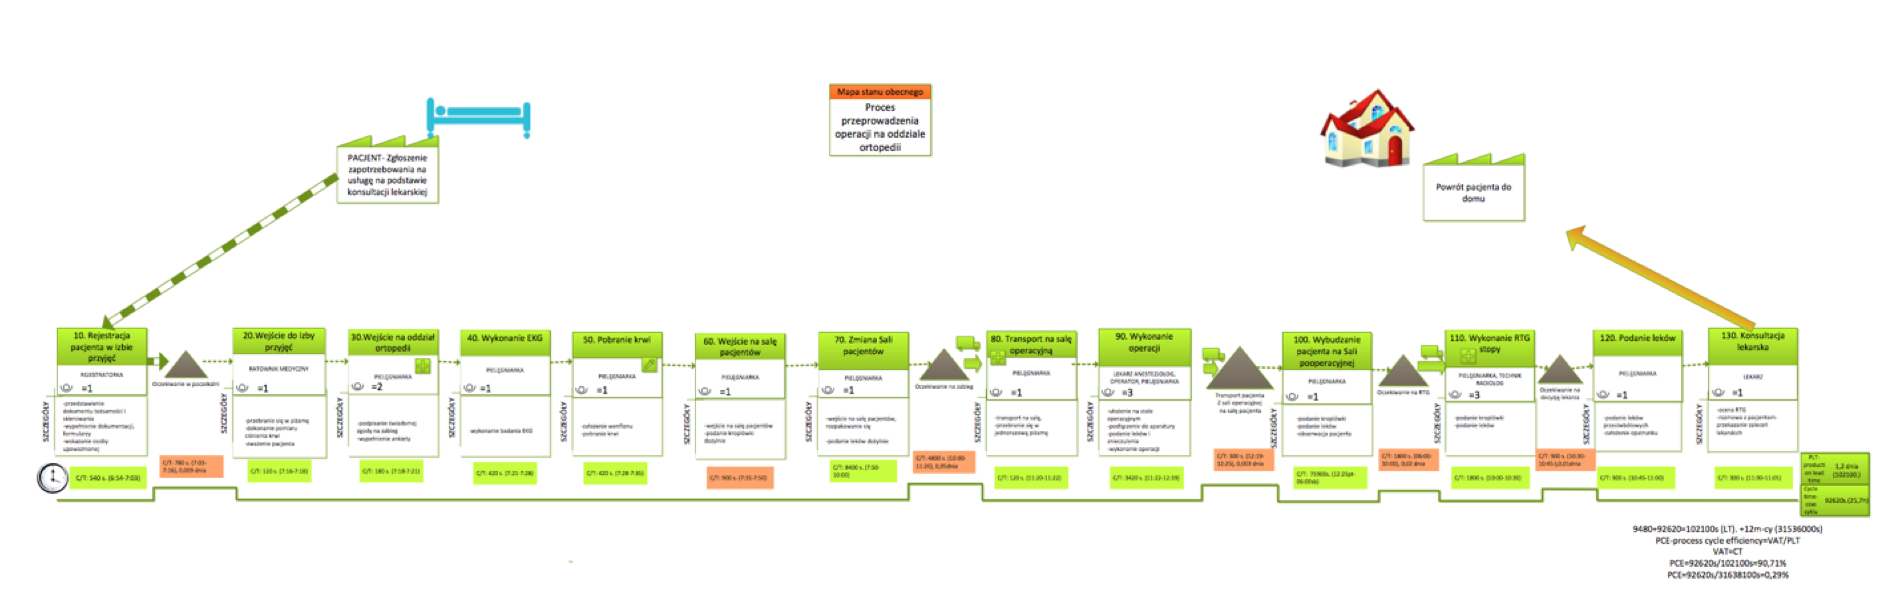
During preparation value stream mapping we should know the process and have relevant information. Then would be possible to eliminate bottlenecks and muda. The very important thing is to define sequence of steps, participants as physicians, nurses, technicians. For every activity we should measure the time of duration. Based on this values would be possible to define Process Cycle Efficiency.
Value stream mapping takes some time and then we can find out bottlenecks. The bottleneck is point in process which cannot recycle given elements in specific time, so queue are presents. It is a place with the lowest productivity.
Visual management
Visualization tool which allow to quickly and easily identify information such as:
- method and organization of the process
- Value added in the whole process and its parts
- Loss / muda (not value added) – based primarily on 8 losses.
- Information influencing and resulting from the process
- Frequency of information
- Type of information (kanban, verbal information, electronic information, instructions, etc.)
- Process tact
- Time and material buffers
- Quantity per unit of measure (number of pieces, seconds, etc.)
- Quantity of human resources in a current process
One of the objectives of the mapping of the value stream is to create a current state map that is currently running in the facility. It shows dependencies and information that are included in the service process. Then create a future state map, ie develop a process that will satisfy the patient and the worker, will reduce the time or cost of work that means it will reach the planned goals.
Each subprocess contains the C / T (time cycle) information which is the actual execution time of the activities that consist of subprocess, L / T (lead time) which is period starting from the time the patient enters the dialysis room to the return to the home by patient and T / T (tact time) is theoretical execution time of the subprocess.
Methodology consists the creation of current and future state maps, three measures of time of two processes and averaging these times. All actions don’t occur after each other, some of them can be executed at the same time.